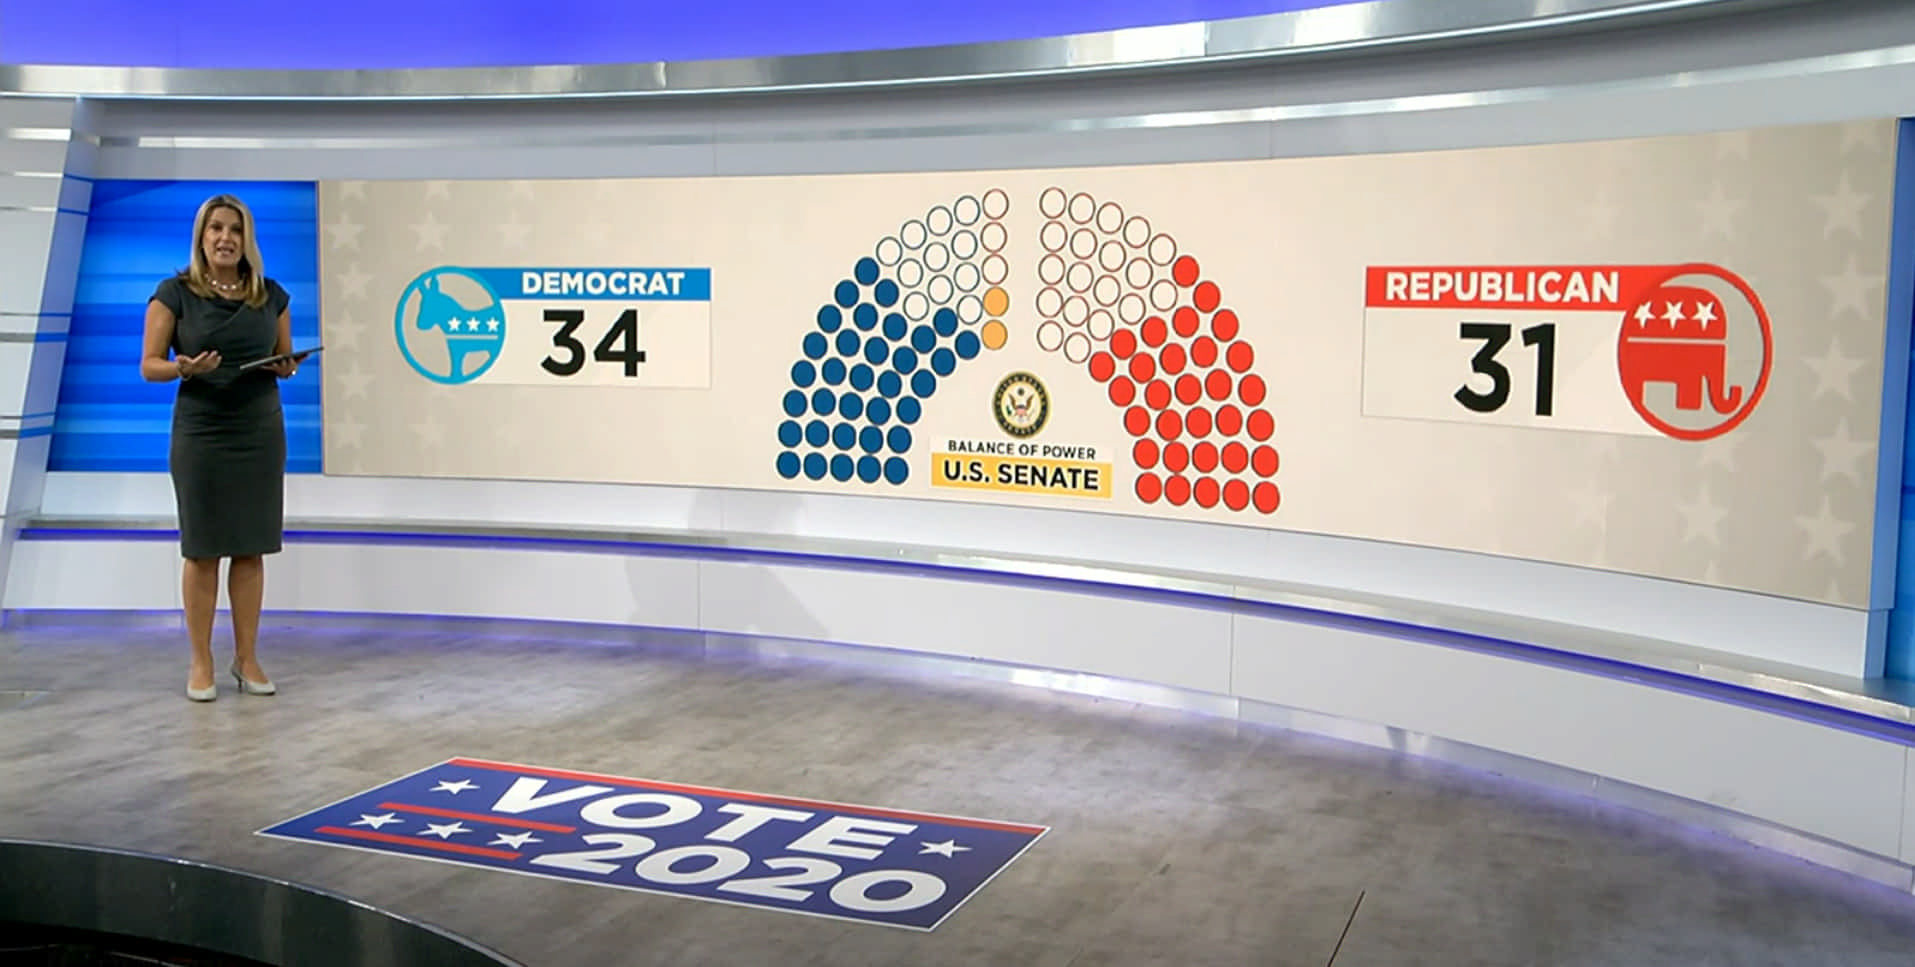
Interactive election mapping provides instant results and dynamic visuals. Our multi-platform custom solution removes the heavy lifting to produce broadcast and OTT content, while adding interactive county-by-county results to your website.
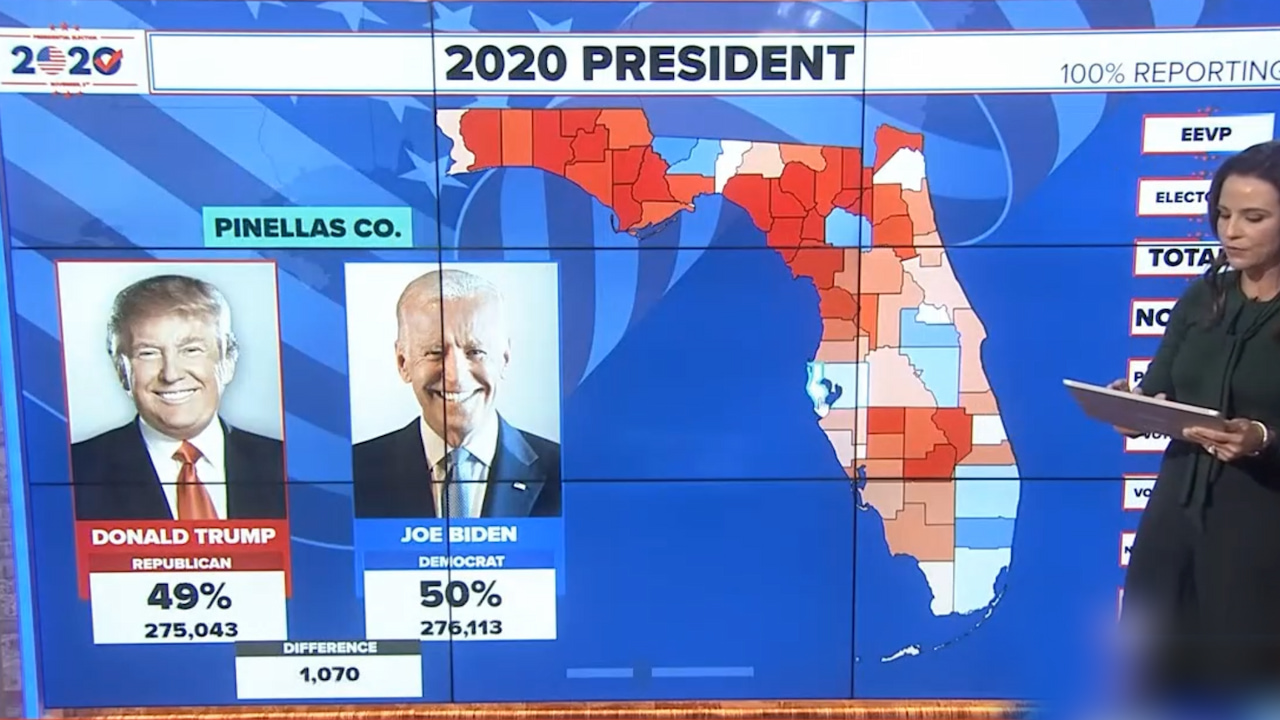
County-by-County Heat Mapping
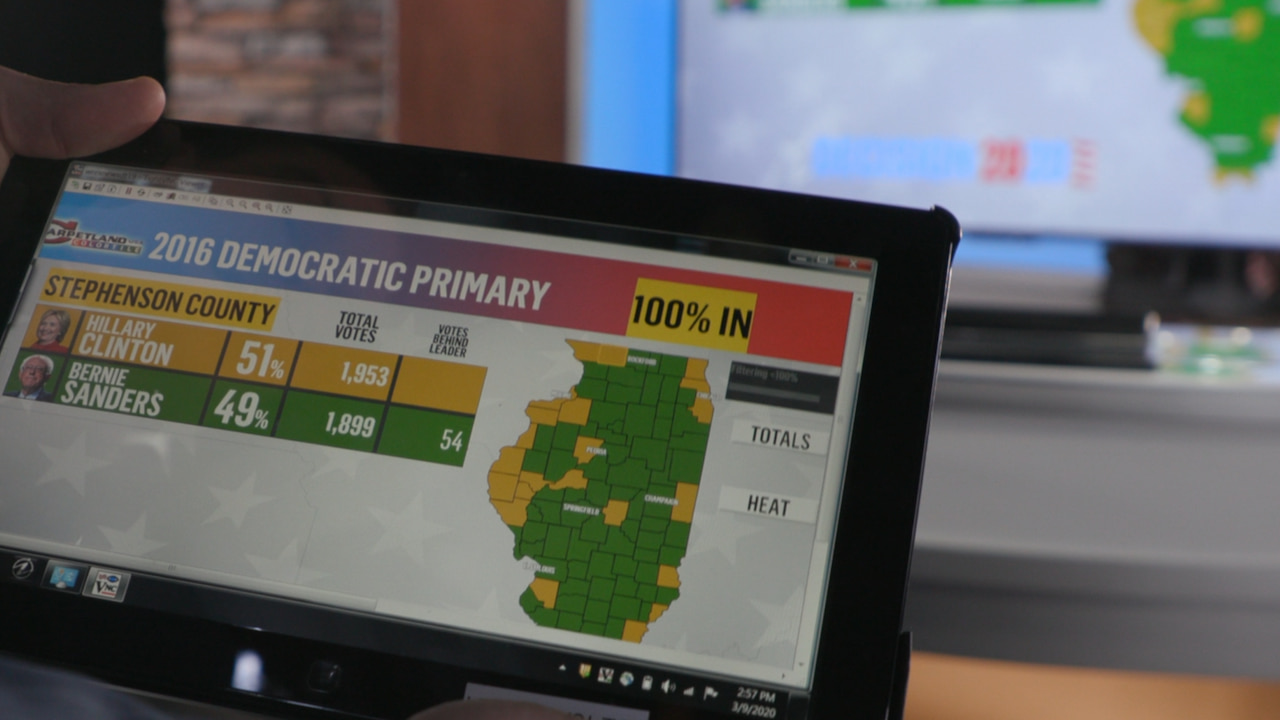
Track real-time data county-by-county to extend viewership across platforms. Follow the race for President, Governor, Senate, track ballot proposals and other statewide races. Our heat mapping software lets you identify which local counties are making the difference. Your data feeds our technology so you can visualize and report on results, trends or surprises as they happen.
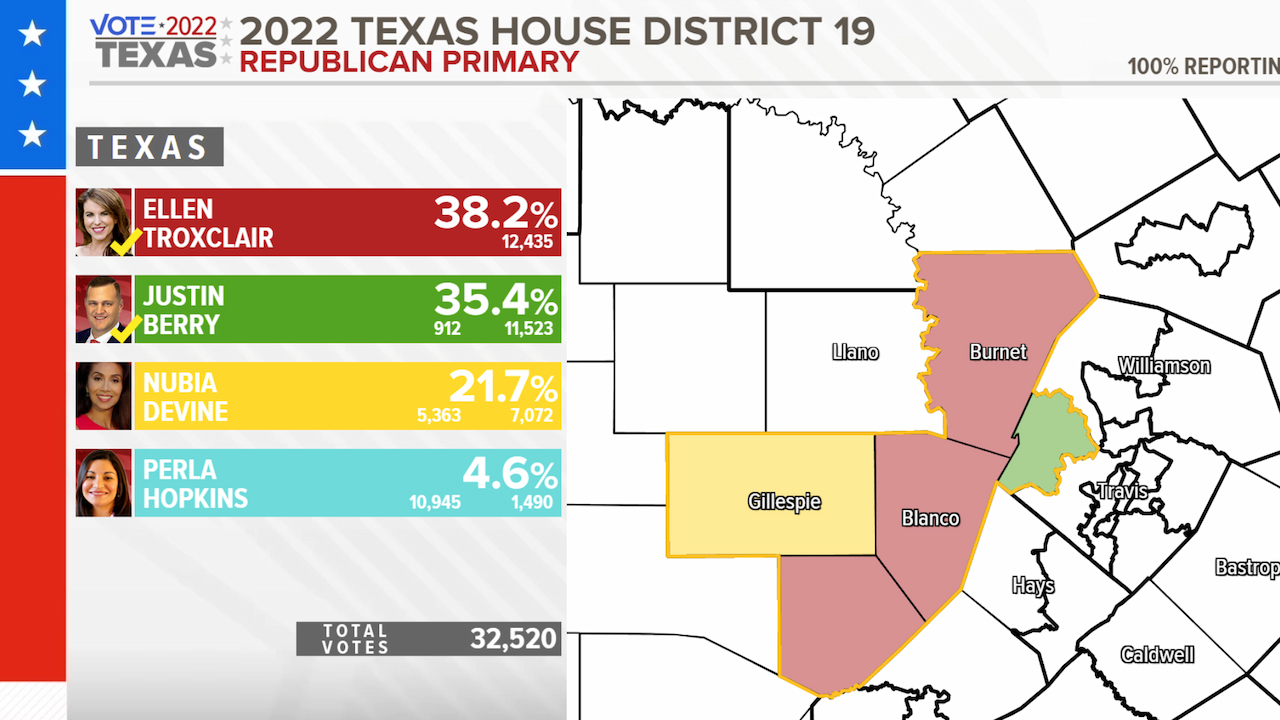
District Mapping
Current and historical district mapping allows you to compare redistricting changes made to Congressional, State Senate and State House maps. Dive into districts to show your audience how each county within a district is voting.
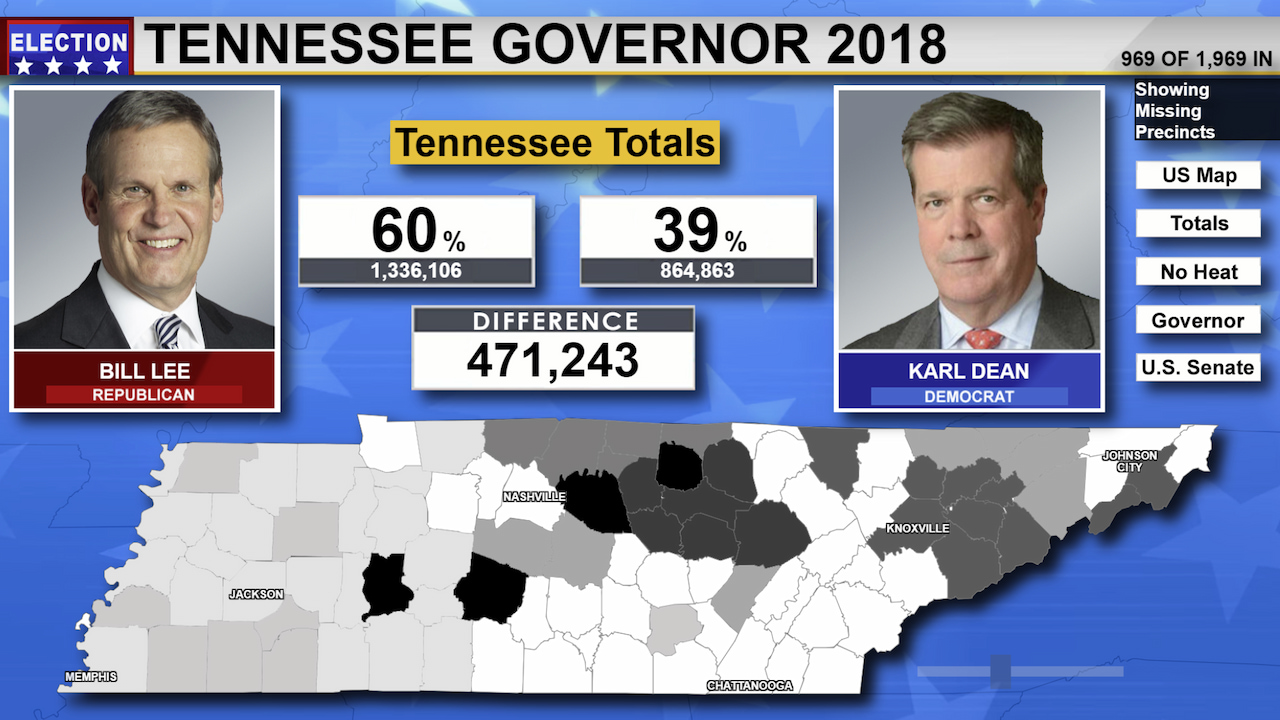
Missing Precincts Indicator
Which counties are lacking results? Magis Election lets you easily share what stories are still unfolding. Real-time data lets you accurately update how many precincts are reporting results and which counties are still reporting a low number of precincts. Missing a highly-populated or hotly-contested county? Our technology lets you share that story as it evolves in a visual, easy-to-understand format.
Pre- and Post-Election Mapping
Magis Election sets your station apart even before election night and supports in-depth reporting after ballots are counted. Pre-election mapping lets you visually report on past results while post-election mapping lets you dig into which counties made the biggest impact on the final tally.
Electoral Map and 270 Tracker
Highlight your state’s role in the biggest story of all – the Presidential race. Trace each candidate’s path to victory with our Electoral Map. Stay in-sync with network coverage and show how your state and region plays a part in the road to the White House. Pre-election, tap into six previous election cycles to visualize how states’ votes changed over time.
Balance of Power
Demonstrate the potential and current impact of each contested race to any shift in power at the national or state level with dynamic visuals that enhance your storytelling.
